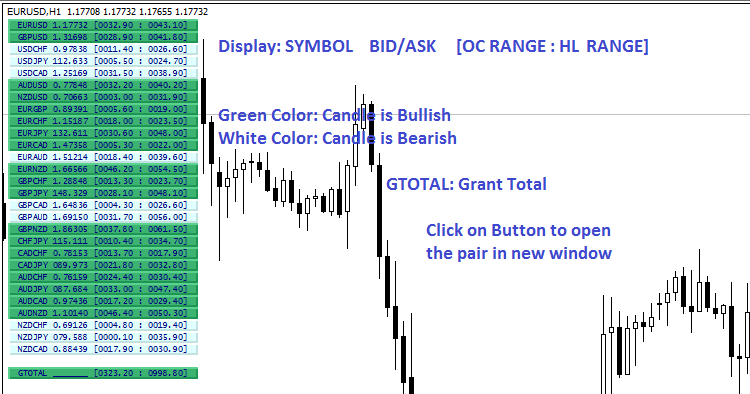
This custom indicator will show you 28 pair's daily candle range, High-Low range, candle bullishness or bearishness from real tick market. So you can understand the overall market situation very short time. You can change the default timeframe from Daily to any period and default candle (bar) number from 0 to any previous number. Also you can open the required symbol by clicking the symbol button.
To understand the indicator's activity, please see the attached image:
Input parameters
- Candle Number - To get real time information, you should use 0 value for running candle. So indicator will show you every point update in panel box. You also can use any higher value than 0 for specific previous candle information.
- Timeframe - Change the timeframe from here. Your chart can be any timeframe, but indicator will show you this period's information in the panel box. Default timeframe is Daily, but you can use any timeframe by changing from here.
- Button Bullish Color - Define your button bullish color from here for the panel box.
- Button Bearish Color - Define your button bearish color from here for the panel box.
- Button Text Color - Define your button text color from here for the panel box.
- Show Market Price - Market price will be bid or ask price. Select from here Bid price or Ask price. If None is selected, no market price will be shown on panel box and panel width size will be decreased automatically.
- Button Height - Define your button height size from here for the panel box.
- Button Font Size - Define your button font size from here for the panel box.
http://vializer.com/A5OB


0 التعليقات:
Post a Comment